

This is the first in a series of posts from Envision exploring what shapes thermal comfort in buildings.
This opening post focuses on personal factors — metabolic rate, clothing and activity level — and how sensitive PMV and PPD predictions are to the assumptions made about them. Later posts in the series will turn to environmental factors, building-specific design criteria and emerging trends.
Thermal comfort carries direct commercial consequences, not just occupant experience. Poor thermal performance can weigh on asset value and letting appeal, as occupiers increasingly select space on comfort and wellbeing credentials as well as sustainability ratings; it drives up operating costs through higher heating and cooling energy demand; and it creates regulatory and compliance risk under overheating requirements such as Building Regulations Part O, planning conditions and BREEAM Hea 05 criteria.
Thermal comfort analysis helps designers understand whether a building will feel comfortable foroccupants across different seasons, use patterns and operational conditions. For project teams, it is apractical way to test design decisions before construction, reduce overheating and cold-discomfortrisks, and support compliance with recognised standards such as CIBSE, ASHRAE, ISO and BREEAM.
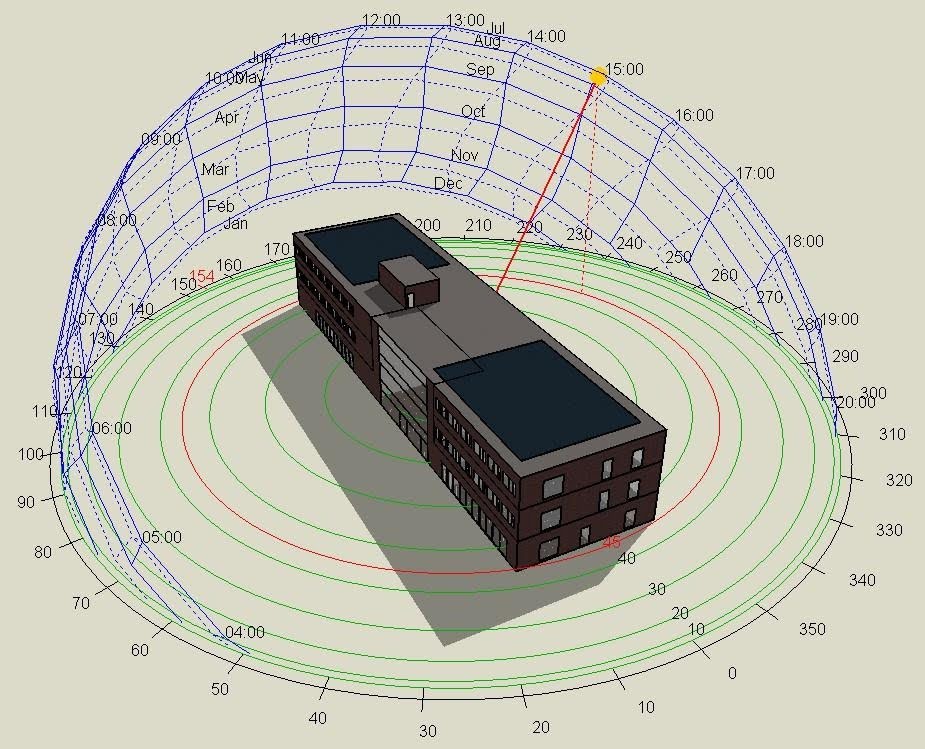
Thermal comfort refers to a state of mind in which individuals feel satisfied with the surrounding temperature. It is a critical aspect of building design and operation because it influences health, wellbeing, productivity, and energy consumption.
Poor thermal conditions, whether excessively hot or cold, can impact concentration, disrupt sleep patterns, and increase energy demand in buildings.
Indoor thermal discomfort can also increase building energy use, as occupants may rely more heavily on heating, cooling or local controls to manage their environment. Achieving optimal thermal comfort requires a balance between occupant needs, environmental design and building engineering.
Key Factors Influencing Thermal Comfort

Thermal comfort is shaped by both environmental and personal factors, making it a complex metric to assess.
Environmental factors include:
- Humidity and its effect on evaporation
- Air temperature and perceived warmth or coolness
- Radiant temperature from surrounding surfaces
- Air movement and the rate of heat exchange
Personal factors include:
- Clothing insulation and layering
- Metabolic rate and activity level (e.g., sitting, walking, exercising)
- Individual sensitivity based on age and health
- Cultural and climatic adaptation
Three of these personal factors drive most of the variation seen in the analysis below, so it is worth explaining them in plain terms. Metabolic rate is the amount of heat the body produces, based on how active someone is: it is measured in “met” units, where 1 met is roughly the heat given off by a person sitting quietly, and it rises with more strenuous activity. Clothing factor (clo) measures how much insulation clothing provides, similar to a tog rating for a duvet: light clothing has a low clo value and traps little heat, while heavier or layered clothing has a higher clo value and retains more. Activity factor simply describes what a person is doing at the time, such as sitting, standing or carrying out light physical work, and it influences comfort because it drives metabolic rate.
Thermal comfort testing and measurement
Several models and standards are used to evaluate thermal comfort. The most commonly used approaches for building overheating risk assessment include:
- Operative indoor air temperature – Assesses compliance with design guidelines such as CIBSE Guide A (UK).
- PMV/PPD (Predicted Mean Vote / Predicted Percentage Dissatisfied) – Estimates how many occupants feel comfortable under specific conditions.
Key design references include CIBSE Guide A, CIBSE TM52, CIBSE TM59, and BREEAM thermal comfort assessment criteria.
PMV predicts the average thermal sensation of a large group of occupants on a scale from cold to hot, while PPD estimates the percentage of occupants likely to feel dissatisfied with the thermal environment. Used together, these metrics help translate technical modelling outputs into a clearer indication of occupant comfort risk.
To demonstrate how personal factors influence thermal comfort predictions, a series of test scenarios was modelled for a typical office environment.
This article tested the personal factors that influence thermal comfort, using PMV and PPD metrics to show how changes in occupant behaviour and assumptions can affect predicted comfort outcomes.
A set of test scenarios was modelled using dynamic simulation software for an office environment. The thermal modelling followed CIBSE AM11 Building Energy and Environmental Modelling guidance, with each scenario testing how changes in occupant-related factors affected the resulting PMV and PPD values.
According to BREEAM thermal comfort assessment criteria, PMV should typically remain between -0.5 and +0.5, with PPD between 5% and 10%. In the modelled scenarios, the operative temperature set points fall within the recommended ranges and support acceptable PMV and PPD results where the occupant assumptions are realistic. This sensitivity study is based on a Summer DSY1 (Design Summer Year) weather scenario only, testing overheating-side comfort risk; it does not cover the cold-discomfort or wider season & building conditions referenced more broadly in this article.
Testing scenarios:1
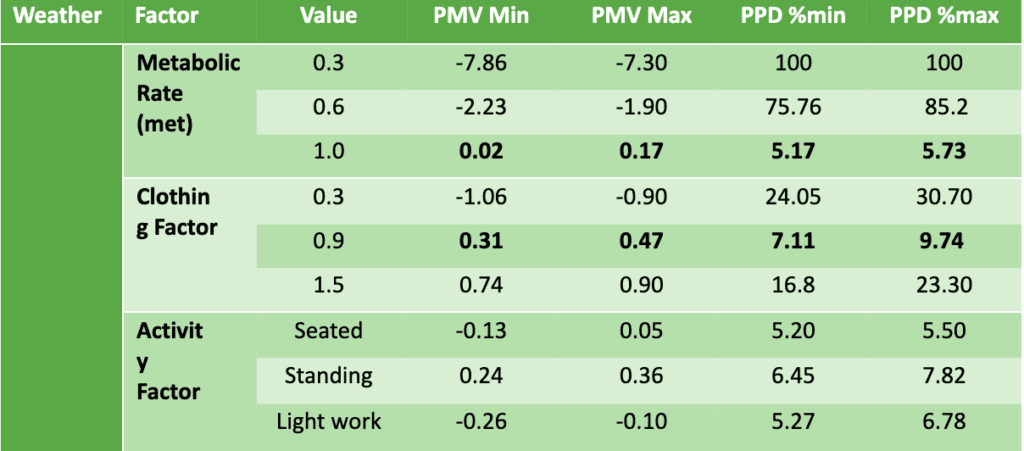
The dynamic simulation results show that occupant-related inputs can significantly influence predicted thermal comfort outcomes in the tested office environment.
Metabolic rate had the biggest effect on the results. At very low values (0.3–0.6 met, well below a typical seated office worker), the model predicted occupants would feel far too cold, with high dissatisfaction: the 0.3 met case reached 100% PPD, while the 0.6 met case remained high at around 76-85% PPD. The 0.3 met case was set at a deliberately extreme, unrealistic level purely to test the limits of the model; it does not represent how an occupant would actually behave. Once metabolic rate was increased to 1.0 met, which is closer to a seated office worker, the results moved into the acceptable comfort range, with PMV close to zero (0.02 to 0.17) and PPD around 5–6%.
Clothing factor had a similar, though smaller, effect. Very light clothing (0.3 clo, roughly a t-shirt and shorts) made occupants feel cooler than intended and increased dissatisfaction, with PMV outside the acceptable comfort band and PPD rising to around 24-31%. Typical office clothing at 0.9 clo kept results within the comfort range set out in BREEAM Hea 05, with PMV between 0.31 and 0.47 and PPD between 7.11% and 9.74%. Heavier clothing at 1.5 clo made occupants feel too warm, with PMV rising to 0.74-0.90 and PPD increasing to around 17-23%.
Activity factor made the least difference of the three. Seated and standing occupants both stayed within the acceptable comfort range, with PMV within ±0.5 and PPD below 10%. Light work also remained within range, with PMV between -0.26 and -0.10 and PPD around 5-7%, showing that the activity assumptions tested here had a relatively modest impact compared with metabolic rate and clothing insulation.
In short, realistic assumptions — a seated office worker at around 1.0 met, typical office clothing at around 0.9 clo and normal office activity — give thermal comfort results that meet BREEAM Hea 05 criteria. Of the three factors, metabolic rate had the greatest influence on the outcome, so project teams should check that this assumption reflects how the building will actually be used, rather than relying on a single default value.
The modelling example above focuses on personal factors in an office environment, but that is only part of the picture. The following factors also affect thermal comfort and will be explored in future posts in this series.
Building Typology
Thermal comfort requirements also vary by building type — residential, office, healthcare, education and outdoor space each bring different occupant profiles and expectations.
Construction Factors
Design strategies for achieving thermal comfort — natural ventilation, fabric performance, shading, glazing, HVAC and airtightness.
Balanced energy efficiency and thermal comfort
Balancing energy efficiency with thermal comfort, and the emerging trends reshaping this field — from smart sensors to updated CIBSE TM59 methodology will be the subject of a future post in this series.
Conclusion
Thermal comfort is more than achieving a target temperature. It is a measure of how occupants experience and interact with indoor environments, influenced by both building conditions and human factors such as activity levels, clothing and behavioural patterns.
The modelling results presented in this article demonstrate that occupant-related assumptions can significantly affect PMV and PPD outcomes, highlighting the importance of selecting realistic inputs when undertaking thermal comfort assessments. Understanding these sensitivities enables design teams to make more informed decisions, improve occupant wellbeing and support compliance with standards such as BREEAM and CIBSE guidance.
This is only the starting point. In the next post in this series, we will turn to the environmental side of the equation — air temperature, radiant temperature, air movement and humidity — and how these interact with the personal factors covered here.
If your project needs to demonstrate thermal comfort compliance — whether for BREEAM Hea 05, Part O overheating assessment, or planning conditions — Envision’s dynamic simulation modelling identifies comfort risk early enough to influence design decisions, protect asset value and control operating costs. Get in touch with the Envision team to discuss a thermal comfort assessment for your next project.

Other Articles
October 13, 2026
BREEAM In-Use in the Industrial Sector: Its Importance and Role in Sustainability
What is BREEAM In-Use? BREEAM (Building Research Establishment Environmental Assessment Method) In-Use (BIU) is an online assessment…

September 11, 2026
Envision Carbon Impact Report 2025-2026
Our Carbon Footprint Report for the financial year 2025-26 is now finalised and marks our fourth full…

July 21, 2026
Using CRREM Analysis to Manage Real Estate Transition Risk
Real estate owners are facing increasing pressure from regulators, lenders, and occupiers to align their portfolios with…